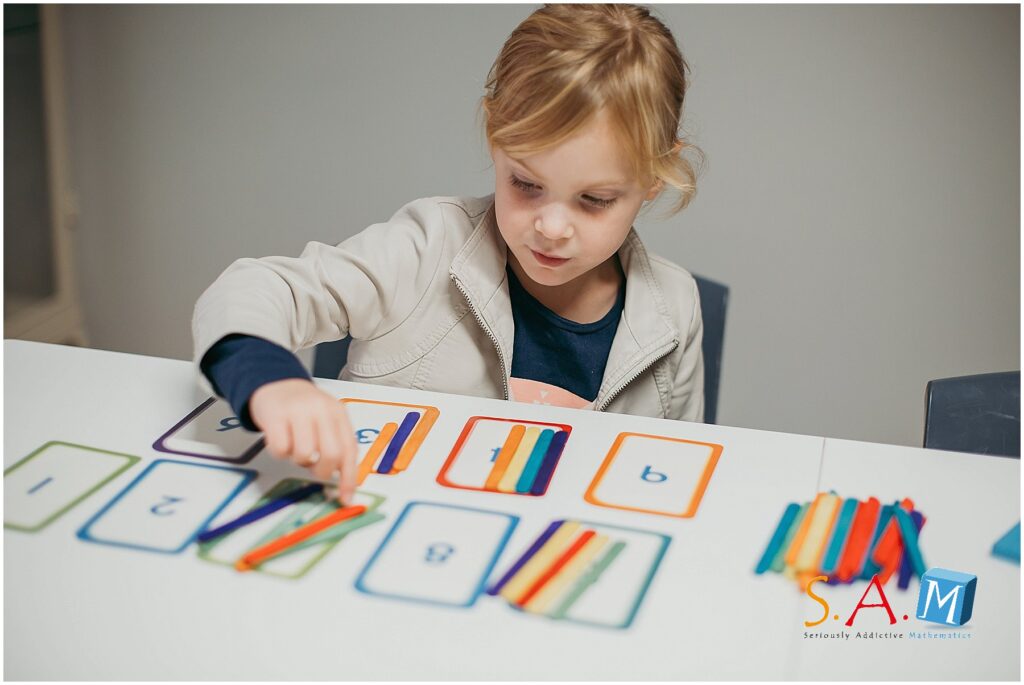
Woven into the complex tapestry of mathematics lies an understated, yet profoundly impactful element: Visualization. Here at Seriously Addictive Mathematics (S.A.M.), where the tenets of Singapore Maths take centre stage, we are ardent believers in unravelling and harnessing the power of mathematical visualisation through graphs, charts, and infographics, thus making the abstract tangibly perceptible.
A Picture Worth a Thousand Numbers
The aphorism, “A picture is worth a thousand words,” takes on a new dimension when brought into the realm of mathematics. Visualising data not only imparts clarity and comprehension but also renders numerical information accessible and engaging to a broad spectrum of learners and observers. Graphs, charts, and infographics bridge the gap between numerical complexity and lucid understanding, facilitating the translation of data into digestible visual formats.

Graphs: Plotting a Course through Numerical Landscapes
Graphs, with their axes, curves, and points, offer a scenic route through numerical data, providing visual insights into relationships, trends, and disparities. In educational settings, particularly within the paradigm of Singapore Maths, graphs become instrumental in helping students perceive and analyse relationships between variables, identify patterns, and make informed predictions.
At S.A.M., students explore various types of graphs, such as line graphs, bar graphs, and pie charts, each offering a unique lens through which to interpret data. The art of crafting and deciphering graphs is nurtured, ensuring that students can adeptly navigate through numerical landscapes, interpreting and projecting data with ease and accuracy.
Charts: Organizing Data into Visual Symphonies
Charts, in their myriad forms, serve as visual organisers, categorising and displaying data in a manner that unveils patterns, hierarchies, and distributions. From simple bar charts that compare quantities to complex Gantt charts that orchestrate project timelines, charts morph numbers into visual entities, enabling observers to glean insights at a glance.
Through activities and problem-solving sessions at S.A.M., students delve into the art of constructing and interpreting various charts, thereby honing their ability to organise, represent, and analyse data in visually structured formats. This skill, vital in various fields such as finance, management, and research, is meticulously cultivated, empowering students to visually orchestrate data into meaningful symphonies.
Infographics: Narrating Stories with Data and Design
Infographics blend data with design, narrating numerical stories through a fusion of statistics, visuals, and text. This form of mathematical visualisation transcends mere representation, incorporating aesthetic and informative elements to convey complex data in a compelling, accessible manner.
S.A.M. students, while navigating through the structured Singapore Maths curriculum, encounter opportunities to explore, create, and critique infographics, thereby developing a nuanced understanding of how to effectively communicate numerical information to varied audiences. This intertwining of data and design fosters not only mathematical proficiency but also a capacity to convey information in a manner that is both engaging and enlightening.

The S.A.M. Journey: Visualising, Understanding, and Applying Mathematics
Embarking on the S.A.M. educational journey, students are immersed in a rich environment where mathematical visualisation is not merely taught but experienced. The art of translating numbers into visuals and deriving meaning from graphical representations is interwoven throughout the curriculum, ensuring that students perceive mathematics not as an isolated subject but as an interconnected tapestry that resonates through various facets of life and knowledge.
Through meticulously crafted lessons, activities, and challenges, students:
- Explore different methods of visualizing data,
- Understand the underlying mathematical concepts and principles,
- Apply this knowledge in various contexts, and
- Create their own visual representations of data.
- The nuanced understanding of mathematical visualisation fostered at S.A.M. is not confined to the classroom but extends into daily life, professional fields, and societal contexts, where data visualisation plays a pivotal role in decision-making, policy formulation, and communication.
Unveiling the Unseen: Making the Abstract Tangibly Visual
In a world inundated with data, the ability to visualise, interpret, and create graphical representations of numerical information is paramount. S.A.M., anchored in the robust Singapore Maths methodology, is not merely an institution but a crucible where the abstract becomes visual, where numbers transform into meaningful, comprehensible visuals, and where students emerge not merely as learners but as adept navigators of the numerical and visual realms.
Join us at Seriously Addictive Mathematics, where mathematics is visualised, understood, and lived, where students embark on journeys through numerical landscapes, and where the unseen is unveiled, making mathematics an art that is seen, appreciated, and masterfully crafted.
Connect with us here to learn more.

